
🍿 2 min. read
Visualizing Data from the Spotify API


Visualizing Data from the Spotify API
How to quickly visualize stats about Spotify artists with Infogr.am
This post will go over how to connect with the Spotify API to collect information about artists using Python 3 and then create an infographic from the data Spotify returned. Below is a preview of what we will be creating before we dive into the details.
Installing Requests
In order to play around with Spotify’s API in Python to gather data about artists, I installed Requests: HTTP for Humans via the terminal using: $ pip install requests. Note: Requests is a library that can be used to make API calls and is not limited to use only with the Spotify API.
spotify.py
Note: You can explore documentation for the Spotify web API here
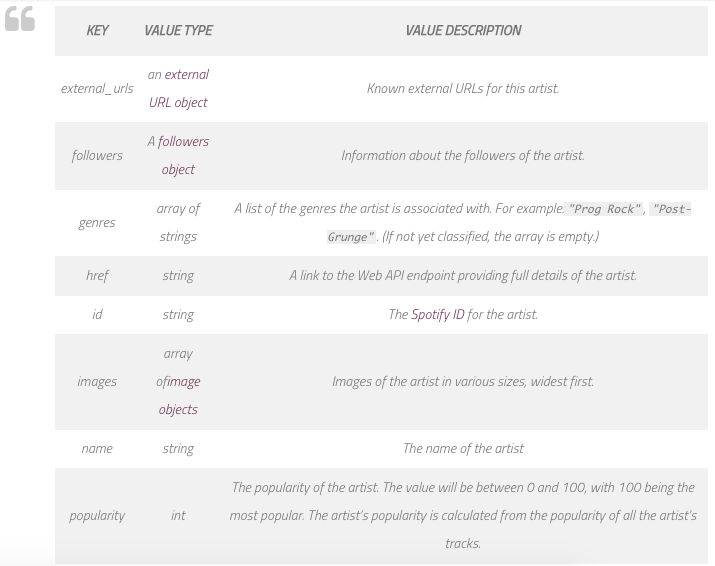
1# importing Requests: HTTP for Humans - installed in previous step.2import requests1# making a search request to the Spotify API to return2# any artist with 'lil' in their name. This request is3# limited to 50 artists in the US market.4response = requests.get('https://api.spotify.com/v1/search?query=lil&type=artist&limit=50&market=US')1# converts the response from a string to a json object that can be parsed in Python.2data = response.json()1#visit this url: in order to see what the json object that is returned looks like:2# [https://api.spotify.com/v1/search?query=lil&type=artist&limit=50&market=US](https://api.spotify.com/v1/search?query=lil&type=artist&limit=50&market=US)1#looking at the 'items' returned for 'artists' in this request.The Spotify API describes items returned from search as:

1lil_artists = data['artists']['items']1# iterating through each artist and their items2# items contains the information we would like to receive for each artist.artist object (full) (from Spotify API)
1# I use two separate for loops because I want to return ALL of the artist names before returning popularity rankings.2for artist in lil_artists:3 # return the name of each artist found with 'search?query=lil&type=artist&limit=50&market=US'1print(artist['name'])Note: Spotify’s API will also return artists that had names that formerly matched query. For example: Boosie Badazz, G Herbo and Bow Wow no longer user ‘lil’ in their stage name however, they are included in this dataset.
returns:
1Lil Wayne2Lil Yachty3Lil Uzi Vert4Lil Dicky5Boosie Badazz6Lil Jon7King Lil G8Lil Durk9Lil Jon & The East Side Boyz10Lil Bibby11G Herbo12Lil Rob13Lil Reese14Lil Keke15Bow Wow16Lil Scrappy17Lil Wyte18Lil Blood19Lil Snupe20Lil Mama21Lil B22Lil' Kim23Lil Cuete24Lil Phat25Lil Debbie26Lil Twist27Lil Trill28Lil AJ29Lil Lonnie30Lil Goofy31Mr. Lil One32Lil Flash33Lil Kesh34Lil Haiti35Lil Silva36Lil Rue37Lil Cray38Lil Eddie39Lil Wayne, DJ Drama40Lil Yase41Lil Suzy42Lil Mouse43Lil C44Lil Rick45Lil Boom46Lil June47Lil E48Lil Fate49Lil' Flip1# returns the popularity ranking associated with each of these artists2 # view popularity definition above1for artist in lil_artists:2 print(artist['popularity'])returns:
18627237246856767276186096010541153125013501448155716491750184519452045214422622340243925432639273728382937303631353236333834393535364337343835394140354133423443344433453846334732483449345049Visualize Data
- Create a free Infogr.am account.
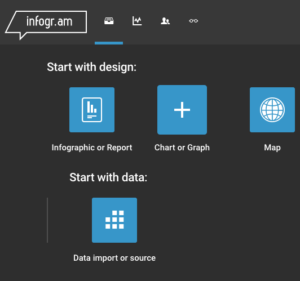
- Select ‘Chart or Graph’
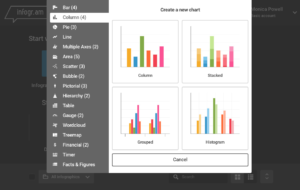
3. Select the type of chart or graph you would like to create
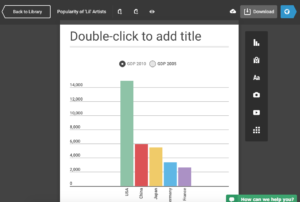
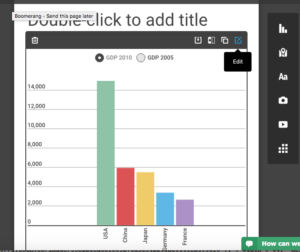
4. The chart will be created with dummy data. Double click on the chart to pull up an black bar with an ‘edit’ button. Clicking edit will allow you to manipulate the data.
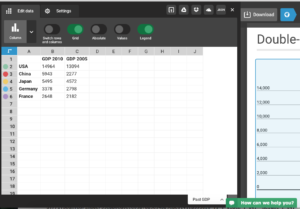
5. Here’s the dummy data that infogr.am automatically includes:
6. Copy and paste the output of:print(artist['name']) andprint(artist['popularity'])
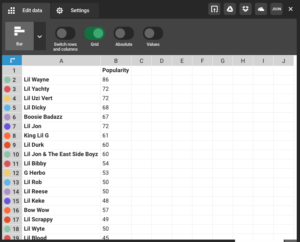
7. The result is a beautiful graphic will all of the data that you pasted into infogr.am. Now you can play around with the visual aesthetic of the graphic.
Example of Infogr.ams I created from this data
With limit of 10 data points: https://infogram.com/popularity-of-lil-artists-1g0n2ow9vygrp4y
With 50 data points: https://infogram.com/copy-copy-popularity-of-lil-artists-1gk92ed3jlq3p16
This article was published on January 27, 2017.